Data: Trust but Clarify
Trust but Clarify is a valuable practice often overlooked in analyzing data. We may follow best practices for bringing the most value to customers. Yet, we may still go awry if we simply follow principle and trust completely what the data is telling us. In his book, The Lean Startup, Eric Ries writes about the processes we used at IMVU. This helped us get Minimal Viable Products out as experiments to observe the customer adoption as the prototypical Lean Startup.
I stepped in after Eric went off to evangelize Lean Startup principles to the industry. I remember an experiment we did on helping our “whale” customers. They were gifting a lot of products to their friends and followers. However, the gifting was a cumbersome, one at a time process. We chose to make this “better” by allowing them to give to groups. So, we did an experiment to make it easy to give to multiple people and collected some data. Much to our surprise there was no noticeable improvement in terms of gifting. Follow ingour methodology, we were ready to scrap the experiment and revert back to the old code. It is bad practice to add functionality that doesn’t bring value.
Data – Trust but Clarify
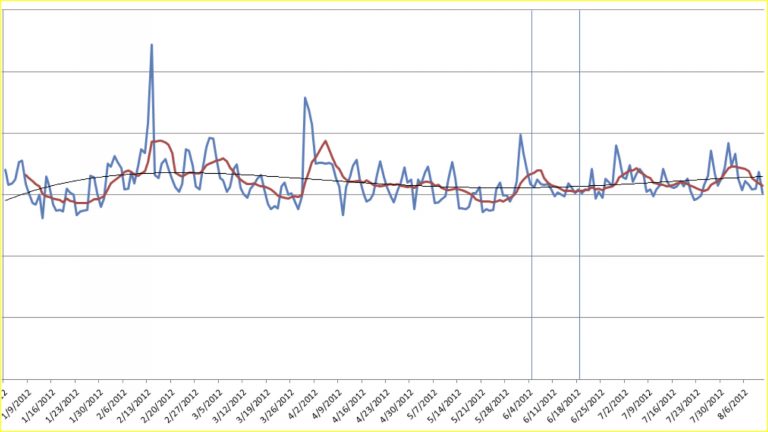
We had very reliable and verified ways of measuring customer behavior for very large numbers of customer. I completely trusted that the data was accurate. However, I felt I should clarify why this was so different from the expected outcome. It didn’t sit right with me. It really should have made a difference if I understood our customers right. I asked that we split the data out by customer type. This allowed us to see the impact of the change on behavior of whales, non-whales, etc. Below are the results of looking at that same data in a more nuanced way:

Low and behold, gifting was way up for customers that were whales. However, it was way down for the typical non-whales and in aggregate, the net change was not noticeable. By making gifting to many users easier, we made it harder for those wanting to gift to just one. Instead of abandoning the experiment, we then allowed for both through the easiest path for each. When customers gift, they spend more credits and increase engagement – both valuable to the business. We could have trusted the first view of the data. Had we thus allowed our decisions to be purely data driven, we would have completely missed this opportunity.
In being data-driven, don’t turn off your brains or ignore your gut instincts about the customer and the business. When it comes to data, as with many things – trust but clarify.
Data: Trust but Clarify – a Simple Coin-Toss Example
In his book Black Swan, Nassim Taleb poses the question “If I were to flip a coin 99 times and it came up tails each time, what are the odds it comes up tails on the 100th flip?”
I love asking this question because the logical, well trained and educated mathematician or computer scientist knows from Probability 101 that the result of a coin-toss is not dependent on previous results. We are taught that a less-educated person might think previous results do matter. However, if we’re open-minded and don’t jump to quick conclusions, we might realize there is something different here. From Statistics 101, we should know that the odds of a coin coming up tails 99 times in a row are essentially infinitely small. A more cautious person might also think: why am I being asked such a simple question?
The wisdom lies in recognizing the bigger picture and considering all the data we are given. By being asked a simple question, we might suspect there’s something deeper there. By recognizing that 99 tails in a row is basically impossible for a “fair” coin, we should conclude that this is obviously not a fair coin. That information is part of the data we are given. However, it’s something we easily overlook when we think we know the obvious answer.
We should trust the mathematics we were taught in Probability 101. However, we should also trust our instincts that despite the pure math answer, there is something strange here. So, the “Trust but Clarify” question here is “Are we talking about a fair coin?”
Asking this coin-toss question in an interview tells me a lot about a person. The initial answer is much less significant than the revealing dialog that follows.
Why Clarify and not Verify?
The more commonly used phrase is “trust but verify.” It may simply, but it can make a big difference. Trust but “verify” implies there is cause for some doubt to the veracity of the data. This can lead to you data science team feeling questioned and attacked. This can lead to defensiveness. You could choose to clarify your understanding of the data. Ask if that same data could be presented differently to provide additional insights. You would now be collaborating with your data science team. In the above example, the data as it was originally presented and 100% accurate. The clarification of what this data looked when broken out by persona added the clarity that improved overall user experience. This was almost overlooked and would have resulted in a missed opportunity.
Trust but Clarify in data from A/B Tests and User Surveys
Prior to IMVU, we acquired a company that had a great product and a large and loyal customer base. I remember meeting the head of product and asking why they had decided to sell. He mentioned that the business hadn’t been going as well as they had hoped for several years. The consistently had issues with customer satisfaction. They had started by implementing the best practices of A/B tests. They always used data to determine which implementation of a feature resonated better with customers. Things surprisingly did seem to get better. So, at the end of each year, they put a big effort in surveying customers. It consistently came back that about 50% of the customers were very frustrated with the product.
They asked their disgruntled customers for specifics on what frustrated them. They took that data and those insight to redesign the user experience. However, for three years in a row, the end of year surveys resulted in 50% of the customers unhappy. Again the grievances were addressed, but no change. Einstein’s quote on insanity comes to mind. So, they sold they company.
Was the Data or the Process Wrong?
Ultimately, neither the data nor their processes were wrong. Both data and industry proven processes did not achieve the desired improvements. It seemed some clarification in how to intepret and act on the data was in order.
I decided to clarify what the data had been telling them. He explained how customers would complain the product was too complex; so, they made it simpler. The the customers would complain that the product wasn’t feature rich enough. I asked if it was possible that they had two types of customers:
- Casual Users – Those that wanted a simple and easy-to-use experience
- Power Users – Experts in what they were doing and that wanted as many features and bells and whistled. Ones that weren’t overwhelmed by some many choice but rather celebrated them.
I further asked if it would be possible to implement two variants. One each based on the type of customer. The product manager’s jaw dropped as he stared at me without words for a couple of minutes. He exclaimed he now knew how in their next release. By solving for both personas they would significantly increase customer satisfaction in their end of year release.
Again, bot the data and the process was “right” the value came from clarifying what it was telling us.
See Also:
- Building Bridges Between Product and Engineering – How building the best solutions starts with understanding the problem.
- Orange Observations – How looking more closely at oranges, or your customers, may reveal things you’ve been overlooking.
- The Dark Side of Agile – why following process religiously has it’s downsides.